Scalar Quantities
Visualize scalar-valued data at the nodes or cells of a volume grid.
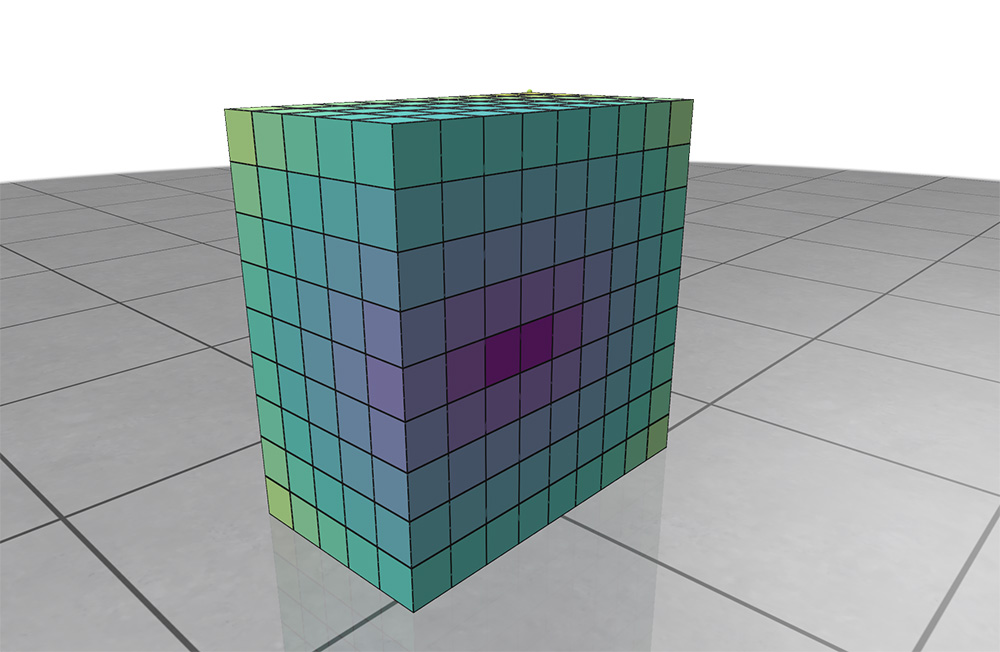
Example: registering a volume grid and adding a scalar quantity
#include "polyscope/polyscope.h"
#include "polyscope/volume_grid.h"

polyscope::init();

// define the resolution and bounds of the grid
uint32_t dimX = 20;
uint32_t dimY = 20;
uint32_t dimZ = 20;
glm::vec3 bound_low{-3., -3., -3.};
glm::vec3 bound_high{3., 3., 3.};

// register the grid
polyscope::VolumeGrid* psGrid = polyscope::registerVolumeGrid(
        "sample grid", {dimX, dimY, dimZ}, bound_low, bound_high);

// add a scalar function on the grid
uint32_t nData = dimX*dimY*dimZ;
float* scalarVals = /* your dimX*dimY*dimZ buffer of data*/;

polyscope::VolumeGridNodeScalarQuantity* scalarQ =
    psGrid->addNodeScalarQuantity("node scalar1",
                                  std::make_tuple(scalarVals, nData));
scalarQ->setEnabled(true);

polyscope::show();
Add scalars
VolumeGridNodeScalarQuantity* VolumeGrid::addNodeScalarQuantity(std::string name, const T& data, DataType type = DataType::STANDARD)
Add a scalar quantity defined at the nodes of the grid.
The data is passed as a flattened vector of length nodeDimX*nodeDimY*nodeDimZ, with data layout such that the X values are changing fastest. For example with 3D xyz indexing, the values would be laid out as [data[0,0,0], data[1,0,0], data[2,0,0], ...], etc.
datais the (flattened) array of scalars at nodes. The type should be adaptable to afloatscalar array; this includes may common types likestd::vector<float>andEigen::VectorXd. The length should be the number of nodes in the grid.
VolumeGridCellScalarQuantity* VolumeMesh::addCellScalarQuantity(std::string name, const T& data, DataType type = DataType::STANDARD)
Add a scalar quantity defined at the cells of the grid.
The data is passed as a flattened vector of length cellDimX*cellDimY*cellDimZ, with data layout such that the X values are changing fastest. For example with 3D xyz indexing, the values would be laid out as [data[0,0,0], data[1,0,0], data[2,0,0], ...], etc.
datais the (flattened) array of scalars at cells. The type should be adaptable to afloatscalar array; this includes may common types likestd::vector<float>andEigen::VectorXd. The length should be the number of cells in the grid.
Add implicit scalars
Implicit helpers
Implicit helpers offer an easier way to interface your data with Polyscope. You define a callback function which can be called at an xyz coordinate to return a value, and pass that function as input. Polyscope then automatically takes care of calling the function at the appropriate locations to sample the function onto the grid.
See Implicit Helpers for more details about implicit helpers, and the meaning of batch helpers.
VolumeGridNodeScalarQuantity* VolumeGrid::addNodeScalarQuantityFromCallable(std::string name, Func&& func, DataType type = DataType::STANDARD)
Add a scalar quantity defined at the nodes of the grid, sampling automatically via a callable function.
funcis a function which takes a singleglm::vec3world-space position as input, and returns the scalar value at that point
VolumeGridCellScalarQuantity* VolumeGrid::addCellScalarQuantityFromCallable(std::string name, Func&& func, DataType type = DataType::STANDARD)
Add a scalar quantity defined at the cells of the grid, sampling automatically via a callable function.
funcis a function which takes a singleglm::vec3world-space position as input, and returns the scalar value at that point
VolumeGridNodeScalarQuantity* VolumeGrid::addNodeScalarQuantityFromBatchCallable(std::string name, Func&& func, DataType type = DataType::STANDARD)
Add a scalar quantity defined at the nodes of the grid, sampling automatically via a callable function.
funcis a function which performs a batch of evaluations of the implicit function. It should have a signature likevoid(float* in_pos_ptr, float* out_val_ptr, size_t N). The first arg is a length-3N array of positions for queries, and the second is an (already-allocated) length-N output array of floats to write the result to. The last arg is the numbrer of queriesN.
VolumeGridCellScalarQuantity* VolumeGrid::addCellScalarQuantityFromBatchCallable(std::string name, Func&& func, DataType type = DataType::STANDARD)
Add a scalar quantity defined at the cells of the grid, sampling automatically via a callable function.
funcis a function which performs a batch of evaluations of the implicit function. It should have a signature likevoid(float* in_pos_ptr, float* out_val_ptr, size_t N). The first arg is a length-3N array of positions for queries, and the second is an (already-allocated) length-N output array of floats to write the result to. The last arg is the numbrer of queriesN.
Categorical Scalars
Scalar quantities can also be used to visualize integer-valued labels such as categories, classes, segmentations, flags, etc.
Add the labels as a scalar quantity where the values just happen to be integers (each integer represents a particular class or label), and set DataType::CATEGORICAL. This will change the visualization to a different set of defaults, adjust some shading rules, and use a distinct color from the colormap for each label.
Color Bars
Each scalar quantity has an associated color map, which linearly maps scalar values to a spectrum of colors for visualization.
See colormaps for a listing of the available maps, and use quantity->setColorMap("cmap_name") to choose the map.
The colormap is always displayed with an inline colorbar in the structures panel, which also gives a histogram of the scalar values in your quantity.
The limits (vminmax) of the colormap range are given by the two numeric fields below the colored display. You can click and drag horizontally on these fields to adjust the map range, or ctrl-click (cmd-click) to enter arbitrary custom values.
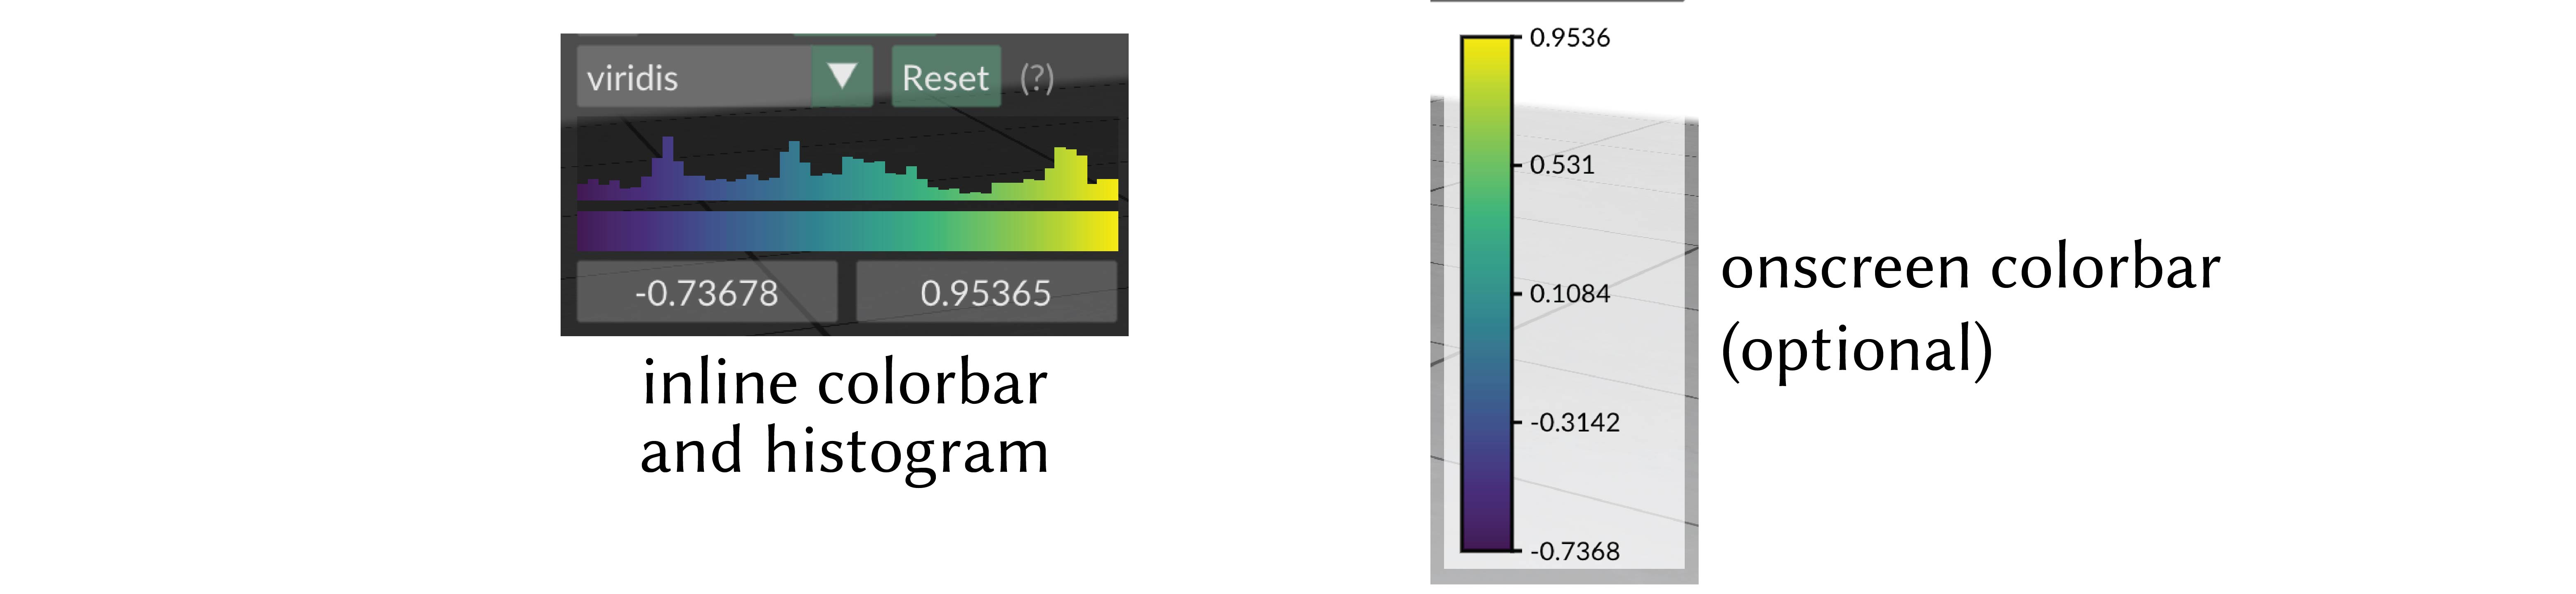
onscreen colorbar
Optionally an additional onscreen colorbar, which is more similar to the colorbars used in other plotting libraries, can be enabled with quantity->setOnscreenColorbarEnabled(true).
By default it is positioned automatically inline with the other UI elements, or it can be manually positioned with quantity->setOnscreenColorbarLocation(glm::vec2(xpos,ypos)).
You can even export this color map to an .svg file for creating figures, via the options menu, or with quantity->exportColorbarToSVG("filename.svg").
Scalar Quantity Options
These options and behaviors are available for all types of scalar quantities on any structure.
| Parameter | Meaning | Getter | Setter | Persistent? |
|---|---|---|---|---|
| enabled | is the quantity enabled? | bool isEnabled() |
setEnabled(bool newVal) |
yes |
| color map | the color map to use | std::string getColorMap() |
setColorMap(std::string newMap) |
yes |
| onscreen colorbar | additional onscreen colorbar | bool getOnscreenColorbarEnabled() |
setOnscreenColorbarEnabled(bool newVal) |
yes |
| onscreen colorbar location | where to put onscreen colorbar, (-1,-1) (default) means auto |
glm::vec2 getOnscreenColorbarLocation() |
setOnscreenColorbarLocation(glm::vec2 newVal) |
yes |
save colorbar to .svg file |
export colorbar to file | void exportColorbarToSVG(std::string filename) |
- | - |
| map range | the lower and upper limits used when mapping the data in to the color map | std::pair<double,double> getMapRange() |
setMapRange(std::pair<double,double>) and resetMapRange() |
no |
| isolines enabled | are isolines shaded (default=false) |
bool getIsolinesEnabled() |
setIsolinesEnabled(bool newVal) |
yes |
| isoline style | stripes or thin contour lines | IsolineStyle getIsolineStyle() |
setIsolineStyle(IsolineStyle newVal) |
yes |
| isoline period | period of isoline stripes, in data units | float getIsolinePeriod() |
setIsolinePeriod(float newVal) |
yes |
| isoline darkness | darkness of isoline stripes (default=0.7) |
float getIsolineDarkness() |
setIsolineDarkness(float newVal) |
yes |
| contour thickness | thickness of isoline contour lines (default=0.3) |
float getIsolineContourThickness() |
setIsolineContourThickness(float newVal) |
yes |
Visualizing Isosurfaces
For a scalar values at nodes, we can additionally extract isosurfaces (aka levelsets) via the marching cubes algorithm, and visualize them as surface meshes.
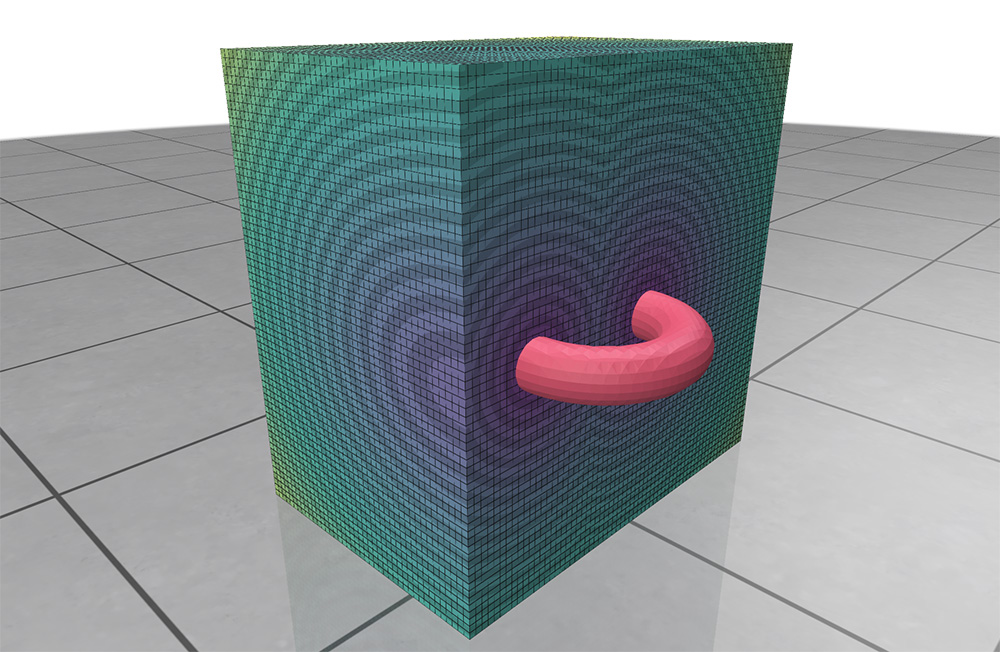
Example: visualizing scalar isosurfaces
/* continued after `scalarQ` has been added as in the first example above */

scalarQ->setGridcubeVizEnabled(false); // hide the default grid viz
scalarQ->setIsosurfaceLevel(0.5); // set which isosurface we will visualize
scalarQ->setIsosurfaceVizEnabled(true); // extracts the isosurface
polyscope::show();

// add a slice plane to cut through the grid while leaving the isosurface
// untouched, as in the screenshot above
scalarQ->setGridcubeVizEnabled(true);
polyscope::SlicePlane* p = polyscope::addSceneSlicePlane();
scalarQ->setSlicePlanesAffectIsosurface(false);
polyscope::show();

// extract the isosurface as its own mesh structure
scalarQ->registerIsosurfaceAsMesh("my isosurface mesh");
The following settings on the VolumeGridNodeScalarQuantity class affect the behavior of isosurfaces.
Note
By default, the grid obscures the isosurface so it cannot be seen. You probably want to either:
- use a slice plane, along with the
setSlicePlanesAffectIsosurface(false)option, or - use
setGridcubeVizEnabled(false)to disable the default grid visualization
| Parameter | Meaning | Getter | Setter | Persistent? |
|---|---|---|---|---|
| enabled | is the isosurface enabled | bool getIsosurfaceVizEnabled() |
setIsosurfaceVizEnabled(bool) |
yes |
| level | at what value to extract the isosurface (default: 0) | float getIsosurfaceLevel() |
setIsosurfaceLevel(float) |
yes |
| color | the color of the isosurface mesh | glm::vec3 getIsosurfaceColor() |
setIsosurfaceColor(glm::vec3) |
yes |
| slice planes affect | do slice planes affect the isosurface | bool getSlicePlanesAffectIsosurface() |
setSlicePlanesAffectIsosurface(bool) |
yes |
| gridcube viz enabled | are the usual gridcubes rendered | bool getGridcubeVizEnabled() |
setGridcubeVizEnabled(bool) |
yes |
You can also register the isosurface as its own Polyscope surface mesh structure for further visualization.
SurfaceMesh* VolumeGridNodeScalarQuantity::registerIsosurfaceAsMesh(std::string structureName = "")
Extract the scalar function isosurface as described above, and register it as its own new SurfaceMesh structure.
structureName` is the name of the newly created structure. If not given, a default name will be automatically generated.