Scalar Quantities
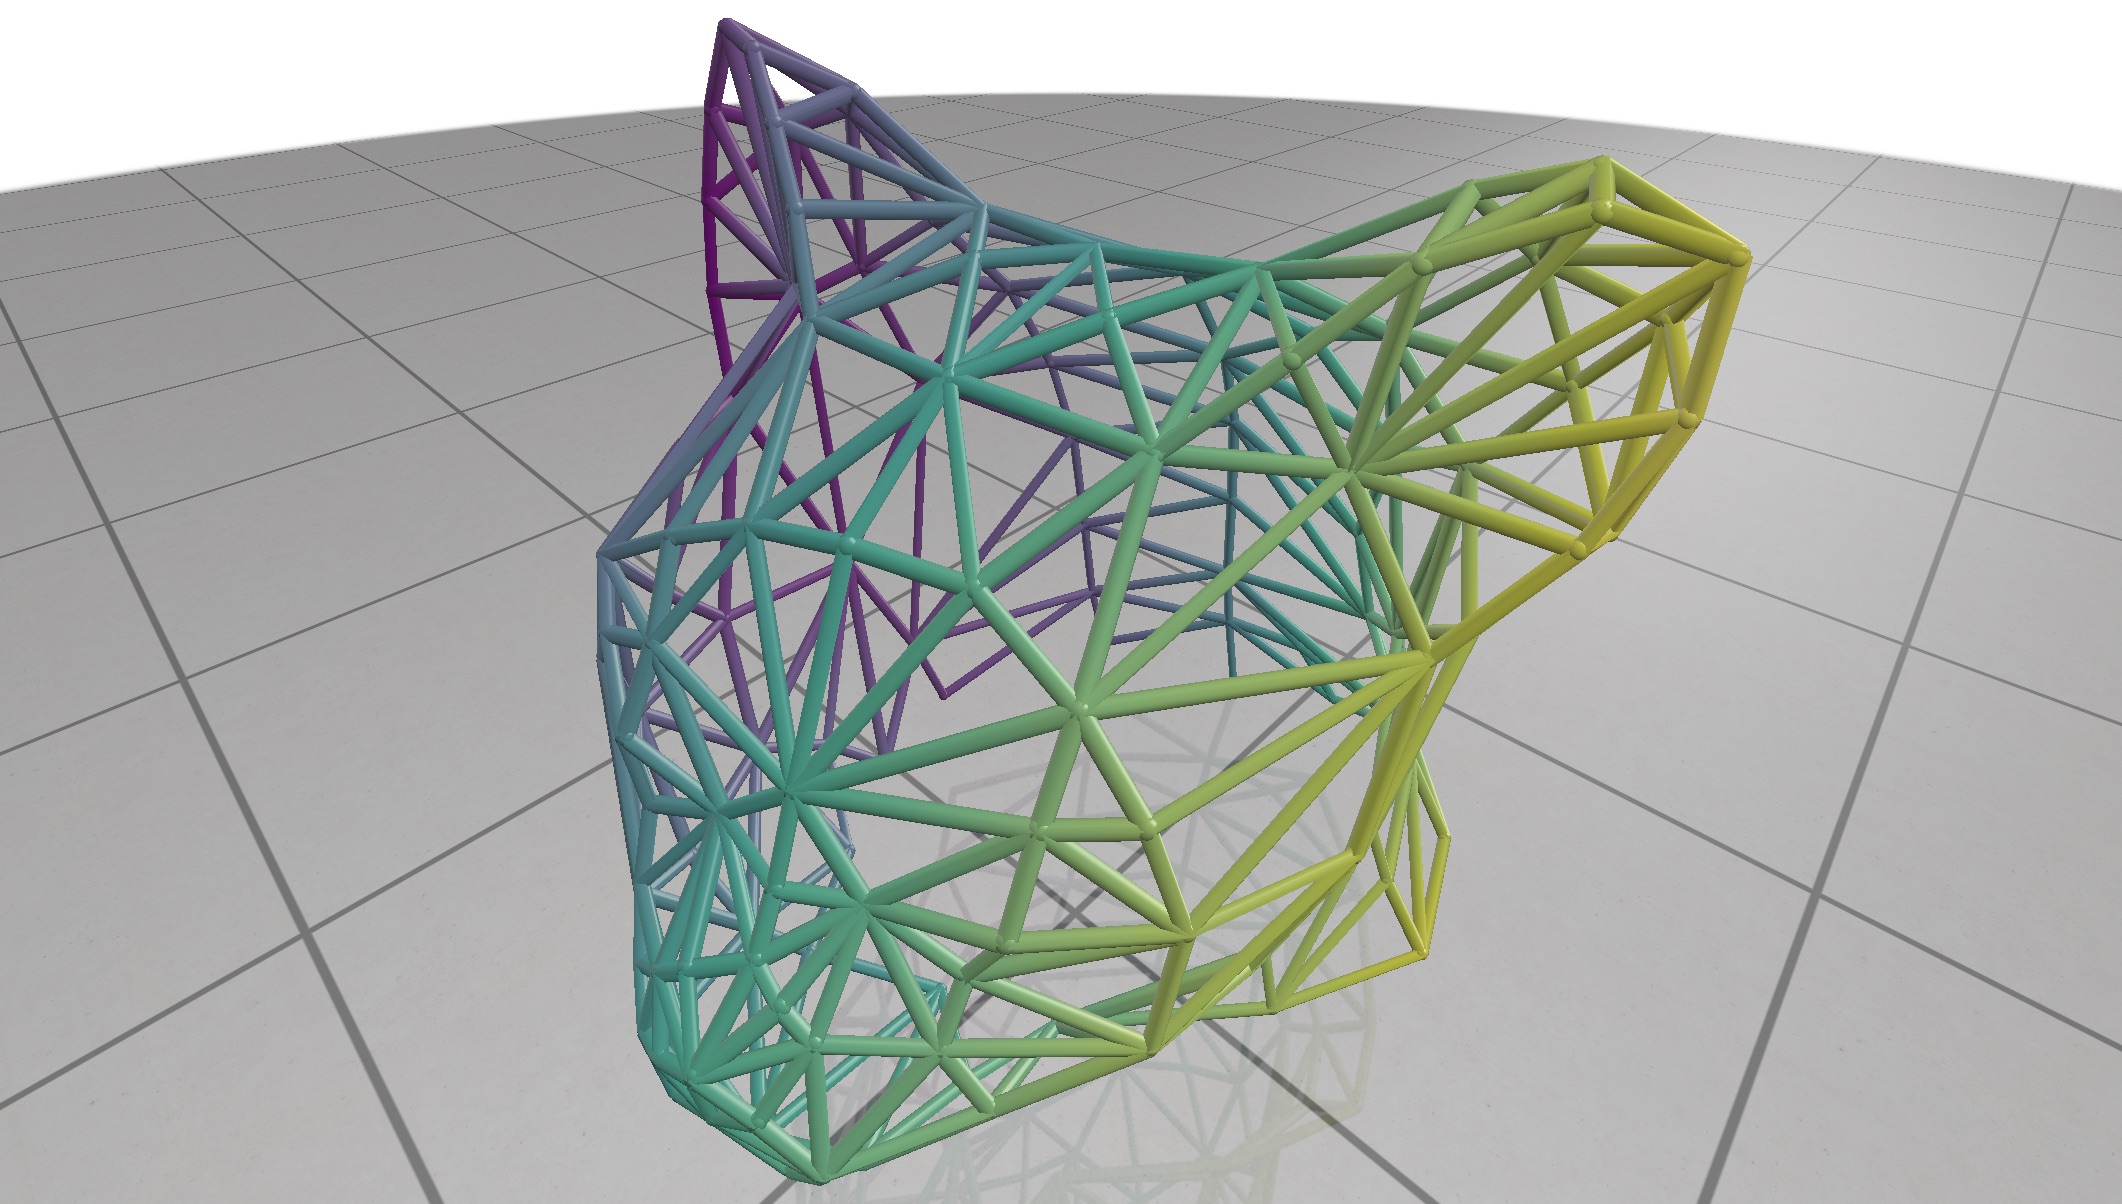
Visualize scalar valued data at the nodes or edges of a curve network.

Example:
#include "polyscope/curve_network.h"

std::vector<double> xC(nodes.size());
for (size_t i = 0; i < nodes.size(); i++) {
  xC[i] = nodes[i].x; // (use the x coordinate as sample data)
}

// visualize
polyscope::getCurveNetwork(curveNetworkName)->addNodeScalarQuantity("sample value", xC);
CurveNetwork::addNodeScalarQuantity(std::string name, const T& values, DataType type = DataType::STANDARD)
Add a scalar quantity to the nodes of the curve network.
valuesis the array of scalars at nodes. The type should be adaptable to afloatscalar array. The length should be the number of nodes in the curve network.
CurveNetwork::addEdgeScalarQuantity(std::string name, const T& values, DataType type = DataType::STANDARD)
Add a scalar quantity to the edges of the curve network.
valuesis the array of scalars at edges . The type should be adaptable to afloatscalar array. The length should be the number of edges in the curve network.
Categorical Scalars
Scalar quantities can also be used to visualize integer-valued labels such as categories, classes, segmentations, flags, etc.
Add the labels as a scalar quantity where the values just happen to be integers (each integer represents a particular class or label), and set DataType::CATEGORICAL. This will change the visualization to a different set of defaults, adjust some shading rules, and use a distinct color from the colormap for each label.
Scalar Quantity Options
These options and behaviors are available for all types of scalar quantities on any structure.
| Parameter | Meaning | Getter | Setter | Persistent? |
|---|---|---|---|---|
| enabled | is the quantity enabled? | bool isEnabled() |
setEnabled(bool newVal) |
yes |
| color map | the color map to use | std::string getColorMap() |
setColorMap(std::string newMap) |
yes |
| map range | the lower and upper limits used when mapping the data in to the color map | std::pair<double,double> getMapRange() |
setMapRange(std::pair<double,double>) and resetMapRange() |
no |
| isolines enabled | are isolines shaded (default=false) |
bool getIsolinesEnabled() |
setIsolinesEnabled(bool newVal) |
yes |
| isoline style | stripes or thin contour lines | IsolineStyle getIsolineStyle() |
setIsolineStyle(IsolineStyle newVal) |
yes |
| isoline period | period of isoline stripes, in data units | float getIsolinePeriod() |
setIsolinePeriod(float newVal) |
yes |
| isoline darkness | darkness of isoline stripes (default=0.7) |
float getIsolineDarkness() |
setIsolineDarkness(float newVal) |
yes |
| contour thickness | thickness of isoline contour lines (default=0.3) |
float getIsolineContourThickness() |
setIsolineContourThickness(float newVal) |
yes |
(all setters return this to support chaining. setEnabled() returns generic quantity, so chain it last)